

Dynamic KPI Bands
A custom KPI designed in BI Office is comprised of:
- Actual Value
- Target Value
- Status Value
Status values are a logical comparison of "actual to target" and indicate how the actual is doing in comparison to the target value (better, worse, same). To make the analysis meaningful, the status value needs to be viewed in the context of ranges (bands) which are the numerical ranges that define what is considered better, worse and the same.
NOTE: Data model (cube) driven KPI's use predetermined bands of -1, 0, 1. They cannot be changed or manipulated from inside BI Office.
KPI Models and Bands
In the Custom KPI designer, the user first picks a KPI Status Model to describe the which logic to employ:
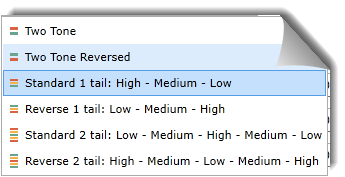
- Two Tone: better or worse
- Two Tone Reversed: worse or better
- Standard 1 Tail: High - Medium - Low (Better - Same - Worse)
- Reverse 1 Tail: Low - Medium - High (Worse - Same - Better)
- Standard 2 tail: High - Medium - Low - Medium - High (Better - Same - Worse - Same - Better)
- Reverse 2 Tail: Low - Medium - High - Medium - Low (Worse - Same - Better - Same - Worse)
Depending on which model is chosen, there can be 2, 3 or 5 bands in the KPI.
KPI Bands
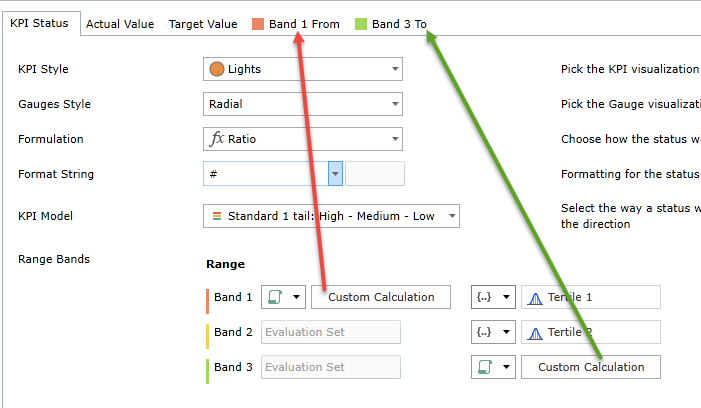
For each band, the user needs to provide the numerical values that will determine the boundaries of each band. In the example below, the user needs to define three bands by supplying 4 values:
- Band 1 (user specifies lowest and highest values)
- Band 2 (user specifies highest value)
- Band 3 (user specifies highest value)
The orange arrows show that the Band 1 highest value also determines the Band 2 lowest value, and the Band 2 highest value also determines the Band 3 lowest value
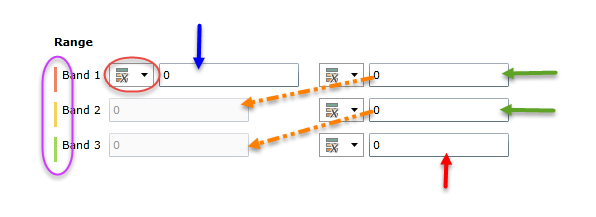
KPI Boundaries
For each boundary, the user can use 4 methods for supplying a value (red circle above).
NOTE: Each boundary can employ a different technique.
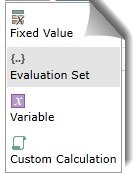
- Fixed Value - is a static number. User should ensure that all the static numbers are logically in order for each boundary.
- Evaluation Set - is a dynamic value generated from querying statistics for a set of figures.
- Variable - is a semi-static value driven by user input during runtime.
- Custom Calculation - is a dynamic value driven by a custom calculation.
Fixed Values
These are the simplest boundary values to provide for KPI bands. They are static numbers that represent the boundaries for the different bands in the KPI definition.
NOTE: To avoid errors, band values should be in numerical order.
Evaluation Sets
Evaluation sets are powerful technique for creating dynamic boundary values quickly.
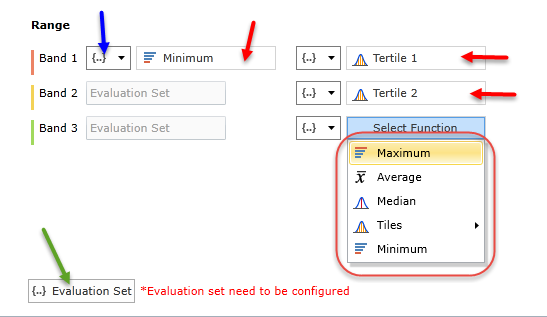
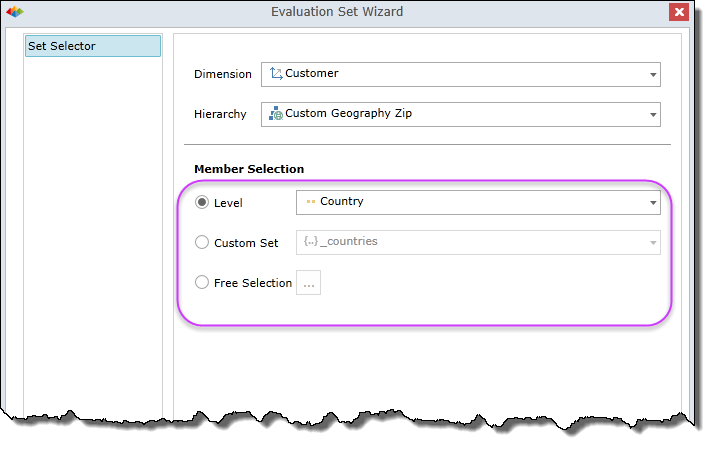
First, the user needs to pick an evaluation set of elements in the data model from which the various values will be drawn (green arrow above). Clicking the button will present the dialog shown below. Users pick elements from the relevant hierarchy in the model using either levels, previously defined custom sets, or a free selection of elements (purple highlight below).
IMPORTANT: The Evaluation Sets option requires a set definition.
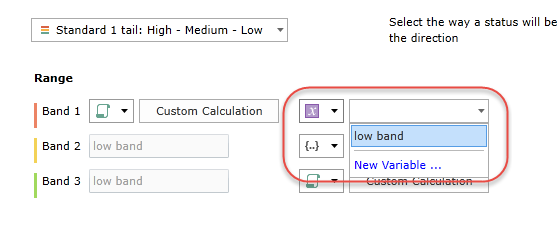
For each boundary, the user sets the type of statistic to draw from the set.
- Select the evaluation set as the boundary logic (blue arrow above).
- Pick a statistic from the drop down box (red highlight above) and repeat for each boundary as needed (red arrows).
The statistics available include: Minimum, Maximum, Average, Median, Percentile 1-9 (meaning 10-90), Tertile 1-2 (meaning 33, 66), Quartile 1-3 (meaning 25, 50, 75), Quintile 1-4 (meaning 20,40,60,80).
NOTE: The lowest and highest values for the "tiles" are min and max.
Evaluation Set Statistic Values
The values driving the boundaries are derived from running the target value calculation in the KPI definition for each element in the evaluation set to derive the statistics.
Variables
Variables provide a UI based element to allow end users to input values into calculations during runtime. In much the same way, variables can be used to define boundary values for one or more bands. As such, variables provide a semi-static interface for KPI banding.
Custom Calculations
Custom calculations provide the most flexible and powerful technique for defining dynamic bands. Each boundary element can be set to a custom calculation. When selected as such, a new tab appears in the Custom KPI designer (red and green arrows below). The new tab allows the user to formulate and set a custom formula for deriving the value of the boundary (in the same way they defined the actual and target values).
Refer to the custom members section for details on how to define members/calculations.
Home |
Table of Contents |
Index |
User Community
Pyramid Analytics © 2011-2022